Monday, December 20, 2010

A New Day, A New Forge (JasperForge, that is)

It was July 2008 when we initially launched what is today our modern JasperForge community web site. How proud we were. Shiny new features all designed to make our community members more capable, engaged, and productive. Now, we’re just as proud of the new version of JasperForge that made its debut a few weeks ago.

How to expand on some pretty sophisticated features already delivered? Our initial Forge already sported features like JasperBabylon, the section of our site where community members can help translate and localize Jaspersoft’s core open source products – or feature voting which allows community members to help prioritize which features are the most important to add or improve next. And, we had already delivered some relatively unmatched scalability and performance, as our Forge hosts more than 180,000 registered community members who collectively log nearly 1M page views and thousands of Forum entries every month.

So, advancing our already advanced Forge platform wasn’t easy. Thanks to our colleagues at Essentia, though, we did it. And so we are now proudly live with the latest release of what may be the open source world’s most advanced individual Forge. What’s key to this new release?
  • Upgraded monitoring and tracking of total visitors to a project page
  • New project download monitoring
  • 40+ canned reports to improve measurement of key site metrics
  • Mercurial support for a de-centralized, high performance version control system
  • Advanced search features to enable faster, more granular results
Of all the new capabilities, I may be most proud that JasperServer is now integrated within the JasperForge platform. This new Forge delivers a wide variety of Administrative reports and analyses designed to allow thorough review of the traffic and activity within the Forge community. Currently only available for Administrators, you can expect future Forge releases to expose relevant analytics to the entire Community.

In summary, I couldn’t have said it any better than Jaspersoft’s technical co-founder Giulio Toffoli:

"I'm extremely pleased to see Jaspersoft broaden JasperForge.org with a number of features that will increase productivity and ease of use. These are big benefits to community users, especially those who rely on low-cost, open source BI. The ongoing improvements to the forge tools re-enforces why Jaspersoft's user community continues to thrive and grow."

If you’ve not stopped by the new Forge, this is your formal invitation to do so. Comments and feedback encouraged.

Brian Gentile
Chief Executive Officer
Jaspersoft

Monday, December 13, 2010

JasperWorld: The Open Source BI Conference

During the past few years, Jaspersoft has (mostly) quietly hosted a wide number of local “meet ups” called JasperDirections. These evening events bring together several of our closest partners along with attendees from our community and customer base. The results have been fantastic, as we’ve hosted nearly 30 JasperDirections events around the world in the past two years, meeting with thousands of customers and partners in the process. As valuable as our customers and community tell us these events have been, I have to believe that Jaspersoft has benefited even more from the interaction and feedback we receive that helps us constantly calibrate our company and product direction. To all of you who have attended a JasperDirections event, you have my thanks and appreciation.

But, now the time has finally come. We’ve reached the point where adding an annual event to these local meet-ups is required. Our thousands of commercial customers (across more than 100 countries), nearly 1,000 software subscription customers, and more than 180,000 community members require and deserve the next step: JasperWorld.


And so we’re in the countdown to our inaugural JasperWorld event, to be held in San Francisco on February 7 – 9. We’ve chosen the Hyatt Regency Fisherman’s Wharf for this first-ever event because of its landmark location and willingness to put up with a bunch of open source BI fanatics for a few days. And we’ve lined up some world-class speakers and entertainment as well.

I’m thrilled to announce that Howard Dresner will provide a keynote address on February 8 and Marten Mickos will do so on February 9. Howard is the well-known business intelligence analyst and industry expert who spent so many years at Gartner, then did an executive stint at Hyperion (until it was acquired by Oracle) and now is the principal of Dresner Advisory Services. Marten is the former CEO of MySQL, the current CEO of Eucalyptus Systems and has been a good friend to Jaspersoft for some time. I’m eager to share the stage with these gentlemen during JasperWorld.

We’re planning a wide variety of technical sessions that enable our partners, customers and community to learn, share and advance their BI agenda – all focused on Jaspersoft products and technologies. Of course, our technical founders (Teodor Danciu – JasperReports, and Giulio Toffoli – iReport) and many of our key technical staff members will attend, lead sessions and be available to meet with customers and community members. And, we have some great partners who will help sponsor this event, enriching the value for everyone. Lastly, we have some fun planned (of course) – Jaspersoft style. You’ll have to attend to learn more!

I hope to see you at JasperWorld 2011.

Brian Gentile
Chief Executive Officer
Jaspersoft

Friday, October 8, 2010

Leading the New Reporting Market

Yesterday, Jaspersoft announced JasperReports Server Professional Edition, our first commercial offering built precisely for those who require sophisticated reports, designed and developed professionally – and scheduled and delivered interactively.

This new offering is architected to match the substantial rise in interest for affordable reporting for both stand-alone and embedded uses - in organizations of all sizes. Indeed, by engaging our community, and listening to their feedback, we designed a reporting server that could address their need for interactive reporting with security and scheduling, while providing the assurance of a commercial subscription.

In addition to a robust feature set (for this reporting customer type), I am proud that we’re making this professional edition product available at a fraction of the price of any traditional competitor – delivering the most affordable and powerful reporting server available in the world today.

JasperReports Server is our recommended product for organizations requiring an affordable reporting solution for interactive, operational, and production-based reporting. Deployed as a standalone reporting server or integrated inside another application, JasperReports Server is a flexible, powerful, interactive reporting environment for small or large enterprises. And, it’s powered by the world’s most popular reporting tools: JasperReports and iReport. Now, developers and users can take advantage of more interactivity, security, and scheduling of their reports with a remarkably cost-effective offering.

I expect this to be the perfect complement to those who’ve been using JasperReports (and iReport) and so we’ve announced JasperReports Server Professional with a special introductory price and we’re making it very easy to learn more about this product. Here are some resources to do so:

Product summary information, including a brief demonstration

Product data sheet

Webinar introducing JasperReports Server Professional

Download a free 30-day trial version

Comparison of all Jaspersoft product Editions

Because Jaspersoft is so well-known for reporting, I’m watching the feedback and questions about this new product very closely. If you have comments or questions, I’d be eager to know.

Brian Gentile

Chief Executive Officer

Jaspersoft

Thursday, September 23, 2010

The Principles of Open Source Software

I believe that, over time, Jaspersoft’s distinction will be less about it being an open source software company and more about its abilities as a great business intelligence software company. I expect declining distinction for our open source-ness will partly occur because the success of open source software and the benefit it brings the community and customers become better accepted and understood each year (and, therefore, less unique). I also believe that the most valuable aspect of the open source model will long endure, way after the sheen fades from the download, forum post or roadmap voting. That is, the principles of open source software are its most distinguishing characteristic and will eventually reach not just all technology companies, but all other industries as well.

As I’ve described in many settings, the principles of open source software are Transparency, Participation and Collaboration. These principles stand, in many ways, in stark contrast to the aged, proprietary ways of doing business. I’ll briefly define and explain each of these three principles.

Transparency

Doing the right thing when no one is watching may be the best definition of integrity. You combine that with frankness and honesty and you have the first open source principle, Transparency. With open source software, anyone can watch. Jaspersoft software engineers and our community contributors know that every line of code they write will be made available for inspection and comment by a very large community. If they have any discomfort with transparency, they would choose a different vocation.

This transparency transcends software engineering, though, to all aspects of the business. In every way possible, an open source company should be transparent; that is, frank, honest and operating with integrity. If a mistake is made – admit it, describe how you’ll make it right and move on. If an important milestone is reached that deserves celebration – announce it, enjoy the moment of pride and move on. This is the obligation an open source company maintains with its customers and community. And, those using the open source projects/products must be equally transparent through their actions and deeds. For example, the community must adhere to the terms of the particular open source license, using the software only as those terms allow, reflecting their transparency. In short, transparency is about doing what you know is right. In a community, the effects of transparency are amplified.

Participation

Actively giving back in a very tangible way is the heart of participation. Making the open source projects, of which each community member is part, more successful and more capable should be the common goal. Giving back can mean many things, including and especially either committing time through code contributions (for those community members with the skill and expertise) or purchasing / licensing the software if the project is in any way commercial open source. Code contributions can include not just feature advancements, but language translations, bug fixes, and quality assurance testing assistance, among others.

Open source community distinction emerges because its members participate by using either their time (i.e., skill) or their money. Either is valuable and helps to make the open source project thrive. The only sin in open source is not participating. In other words, if a community member is using open source software and deriving real benefit from its existence, then participating by providing time or money should be seen as basic and reasonable reciprocity.

Collaboration

Collaboration is about collective engagement for the common good and is the fastest route to open source project success. If an open source project is a neighborhood, then collaboration is the barn raising. Distinguishing this from “participation”, collaboration is about helping others in the community because doing so advances the project and its usefulness for everyone.

My favorite example of collaboration is knowledge sharing through forums, blogs and idea exchanges (in some circles, called ideagoras). On JasperForge, Jaspersoft’s open source community web site, there are more than 160,000 registered members who have collectively offered nearly 80,000 forum entries across all the listed top-level projects. The variety of questions and issues being addressed by and for community members within the forums is staggering. And, the vibrancy that emerges through this exchange of skill is core to large-scale community success.

While forum activity remains brisk, I’m equally proud of our guided use of an idea exchange within JasperForge. Each top-level project includes a roadmap where community members can comment and vote on planned features. This not only allows many voices to be heard, but provides a valuable calibration for Jaspersoft and its community, ultimately yielding the most important product features and advancements in approximately the best priority order.

There are many more examples of collaboration in action, across JasperForge and other leading open source sites, but these are some of my favorites.

I talk about these three principles of open source regularly, and I’m fond of concluding that the real benefit of collaboration accrues to those who participate transparently. That’s just my clever way of mentioning all three the open source principles in one actionable sentence. What are your favorite examples of these open source principles in action? Your thoughts and comments are always welcome.

Brian Gentile

Chief Executive Officer

Jaspersoft

Monday, August 9, 2010

What’s Next for Data Analysis? Part II

In my last post I focused on the emerging trends that will drive the next generation of data analysis. I cited four substantial shifts in both the technologies and customer uses that will be amplified in the next several years. I also mentioned that these trends and technologies are surely influencing our road map and plans at Jaspersoft.

For this blog post, I’ll describe which technologies will likely fuel these changing usage patterns and some product categories that will, therefore, get a boost.

Analytic Databases
These are data stores that use sophisticated indexing, compression, columnar, and/or other technologies to deliver fast querying for large data sets. Increasingly, newer entrants in this category are less expensive that their enterprise data warehouse and OLTP counterparts. Although natively these databases require structured data formats, they provide a tremendous new capability to deal with large data volumes affordably and with greater processing power. When combined with a sophisticated analytic tool (such as a ROLAP engine or in-memory analysis techniques), an analytic database can deliver speed, volume, and sophisticated multi-dimensional insight – a powerful combination. For more on this product category, check out this prior post.

Distributed Data Processing via Hadoop
Large volumes of distributed data, typically generated through web activity and transactions, is the fastest growing data type. This data is commonly unstructured, semi-structured or complex, and holds great promise for delivering keen business insight if tapped properly. With the open source project Hadoop, and some upstart open source companies working to commercialize it, that previously untapped information capital is now ready to be unlocked. By enabling massive sets of complex data to be manipulated in parallel processes, Hadoop provides businesses a powerful new tool to perform “big data” analysis to find trends and act on data previously out-of-reach. Increasingly, big data will be a big deal and this is an important area to watch.

Complex Event Processing
On their own, large data volumes already create difficult analytic challenges. When that data is being created and updated rapidly (even imperceptibly to humans), a different approach to analysis is required. CEP tools monitor streaming data looking for events to help identify otherwise imperceptible patterns. I’ve referred to this technological concept elsewhere as the converse of traditional ad hoc analysis where the data persists and the queries are dynamic. With CEP, in a sense, the query persists and the data is dynamic. You can expect CEP-based, dynamic data analysis functionality to become more interesting and capable across a wider variety of uses each year.

In-Memory Analysis
More simple, integrated, multi-dimensional views of data should not be available only to those who spent two weeks in a special class (think ROLAP or MOLAP). They should exist alongside your favorite bar or line chart and tabular view of data. The analysis should also be constructed for you by the server, persist in memory as long as you need it (and no longer), and then get out of your way when finished. Interacting with it should be as straightforward as navigating a hyperlink report and pivot table -- although a variety of cross-tab types, charts, maps, gauges and widgets should be available for you to do so.

Statistical Analysis
Ever since IBM acquired SPSS, statistical modeling is cool again (since when is IBM cool, btw?). The truth is that the natural progression when analyzing past data is to project it forward. With the need to deal with larger volumes of data and at lower latency, it stands to reason that predicting future results becomes more important. This is why I believe the R revolution is here to stay (R is the open source statistical analysis tool used by many in the academic and scientific world). I predict a growing commercial need for this open source juggernaut, and by this I mean a growing demand for tools based on R with more robust features and a commercial business model – and a few software companies are delivering.

Mashboards
If you follow the Open Book on BI, you know I’m a big fan of mash-up dashboards. I expect these flexible, web-based constructs to deliver the most pervasive set of contextually relevant data, gaining broader use and enabling better decisions even without fancy predictive tools (although the output from a statistical model should be embeddable within a mashboard, maintaining its link back to the model and data source along with any relevant filters). Earlier this year, I wrote an article about making better, faster decisions through the clever use of mashboards. Making those good decisions is about understanding the past and recognizing current patterns, all while understanding the proper context. These relevant visual data elements should come together in a single, navigable view. Perfect for a mashboard.

So, this is my short list of business intelligence product categories and technologies that stand to gain substantially in the next few years. Surely I’ve not covered them all so your comments and feedback are encouraged.

Brian Gentile
Chief Executive Officer
Jaspersoft

Thursday, July 29, 2010

What’s Next for Data Analysis? Part I

I’m commonly asked this question in a variety of circles and on several continents. I consider it one of the more interesting aspects of my job to have these types of predictive, future-oriented conversations with a wide variety of people: customers, partners, technologists, journalists, analysts, consultants, entrepreneurs, financial analysts, researchers, and so on. So, I sat down recently to simply document my answer to the question “What’s Next for Data Analysis?” Here are my thoughts.

I believe the next few years will be an amplified continuation of what we've seen in the past few years, albeit with a severely web-focused, any-client device emphasis. Many of the patterns I’ll cite have been underway for some time; it’s just that the more simple and affordable ability to implement them has only recently caught up with the ambition.

Here goes. Next-generation data analysis will . . .

. . . embrace the rise and use of “big data” for nearly any size organization. I’ve long said that big, distributed data is not limited to big enterprise and many companies will find valuable insight because they can sift through it all to find new answers.

. . . require a more varied set of "analytics" - from responsive and unstructured to predictive and highly-structured. There are many ways to use data productively. Sometimes understanding the past is the most important point. Sometimes being able to predict the future, based on the patterns of the past, is required. The lines here will blur and more organizations will need both and many types in between.

. . . demand greater use of low latency analysis, which decreases the time between a business event occurring, its analysis, and a decision that is based on it. Sometimes this is referred to as “real-time BI” and other times “streaming analytics”. Let’s just call it useful and necessary in more environments each year.

. . . be untethered from traditional client computing network practices. I’ll repeatedly say “analytics anywhere”, which means purely web-based, open standards-aware, (multi-) thin client architecture. That’s a mouthful, but it needs to be the starting point for business intelligence system design (and this is where the mega-vendors’ mostly aged architectures fall short, btw). The most appropriate analytic experience should be deliverable to any device, because both the thin client or native mobile front-end application (where necessary) and the back-end (web) services understand and adapt. More users will expect this every year.

The combination of these clear patterns and trends is surely driving our product and technology roadmap at Jaspersoft. It’s also positively impacting our work with our far-flung community, where so many of our ideas become grounded. Internally, we talk about speeding the movement of “data to dashboard” so the user has the advantage of working with timely and relevant data, presented elegantly and in the proper context. This is our central thought. If you’re interested in learning more about the analytics landscape, from Jaspersoft’s perspective, we’ve published this white paper.

Next post, I’ll describe the recent BI and data management technologies that stand the most to gain as these shifts occur. In the meantime, let me know what you think.

Brian Gentile
Chief Executive Officer
Jaspersoft

Wednesday, July 14, 2010

Survey Results Point to the Future of Java and MySQL

I’ve been enthralled with Oracle’s acquisition of Sun since the day it was announced, because of what it represents to the foundation of open source software. My very first blog post on this matter, in April of last year, focused on the hearts and minds of the developer, in this case through two of Oracle’s most important acquired assets: Java and MySQL. My concluding remark was “stay tuned”.

Now we fast-forward more than one year. The deal is (finally) concluded and things are settling, right? Not taking anything for granted, I commissioned a survey of Jaspersoft’s substantial registered community members (numbering more than 130,000 at the time of the survey, April 2010, but now at 150,000). Because nearly 70% of Jaspersoft’s community is comprised of software developers (substantially using Java, MySQL and related tools), we felt our findings could be important. And, indeed, they did not disappoint.

We asked the Community about their planned future use for Java and MySQL versus competing technologies and products. We asked them about the expected pace of innovation for these two products and if they believe the community processes would be maintained. In short, we gained a capsule of information regarding the likelihood that these two foundational technologies would remain relevant, or become more so. Here’s a summary of our findings:
  • 43 percent of respondents believe MySQL development and innovation will improve under Oracle;
  • 80 percent of respondents believe the Java process will improve or stay the same;
  • The most popular alternative to MySQL cited by respondents who said they planned to switch databases away from Oracle, is PostgreSQL. But only 5% indicated they would switch.
  • 59 percent of survey respondents were not aware that Oracle reorganized and established a completely separate MySQL business unit from the Oracle’s traditional RDBMS business, which includes separate and dedicated engineering, professional services, sales and marketing.

So, it seems that not only is Oracle’s stewardship and ownership of these critical open source products safe for now, but it could lead to a resurgence for Java and even greater success for MySQL. We considered these findings surprising and hopefully good for open source software overall.

You can find our press release, announcing these findings here. And, you can find a complete copy of the survey results white paper here. You can imagine, given my investment of time on this topic, that I’m interested in your thoughts and comments.

Brian Gentile
Chief Executive Officer
Jaspersoft

Tuesday, June 15, 2010

Columnar Databases and the Future of Analytics

Delivering deeper data analysis, in formats more consistent with end-user expectations, has been a passion at Jaspersoft for several years. This passion will continue because making analytics, up to and including the sophisticated multi-dimensional type, more accessible and usable must be the goal of the BI provider who claims “pervasiveness” as its mantle. To help our community and customers know and influence where we’re going, we’ve published white papers that describe our view of the broader analytics landscape as well as one that describes the different types of analysis that our tools offer (e.g., in-memory analysis versus traditional, OLAP analysis).

Making data analysis a more common part of every business person’s day is fast becoming the province of both the database and the analytic tool. To advance the analytic agenda, columnar data storage engines, complete with speedy, in-memory techniques, help streamline query processing - delivering results in an instant and at a very low cost. Jaspersoft and its customers have been taking advantage of this trend growingly during the past two years. For example, in addition to analytic databases for enterprise data warehouses like GreenPlum, Jaspersoft has certified its products on columnar analytic databases including Vertica and Infobright, and we have many joint customers together. In many cases, the combination of in-memory-based analytics (within our BI tool) and the strengths and speed of the analytic database, obviate the need for building and maintaining not only star schemas in the data base but traditional OLAP cubes for the BI tool as well. Now that’s the beginning of analytics for everyone.

Interestingly, the pioneer in columnar technology for business intelligence usage, Sybase IQ, is one of the gems to be picked up by SAP. It recently announced its intention to acquire Sybase, and most speculation around the intentions have focused on Sybase’s treasure chest of mobile solutions. While I appreciate the mobile aspects, the combination of SAP’s Business Objects with Sybase IQ could be a formidable, albeit expensive and proprietary, competitor in the changing analytics landscape.

Furthering this analytic future solidly, Ingres last week announced the general availability of its VectorWise commercial analytic database that takes columnar technology even further. And, Ingres plans to provide an open source version before the year is out . Ingres describes VectorWise as next-generation analytic database technology as its announcement summarizes:

“Ingres VectorWise unlocks the power of modern commodity CPUs with a revolutionary database engine that leverages vector-based processing and on-chip memory to provide dramatic 10x - 70x performance gains over other databases.”

The performance claims are being validated by both customers and partners – and it just may be that Ingres has some groundbreaking new technology on its hands. With free downloads, trials, tools and documentation, Ingres is inviting the world to check it out. If it can use low-cost leadership along with super-fast processing to drive faster, interactive analytics and richer data visualization onto the laptops of more knowledge workers, I think Ingres VectorWise will have an important seat at the table of the future of analytics in the enterprise. Imagine that.

Brian Gentile
Chief Executive Officer
Jaspersoft

Tuesday, June 1, 2010

The Gulf Oil Spill should use an open source response

When BP CEO Tony Hayward first jumped into the spotlight in the days after the tragic explosion at the start of this massive leaking oil well catastrophe, he initially seemed reasoned, convicted and in control. As days passed and technique after technique failed to stem the flow of oil into the Gulf, the executive leadership and companies involved seem inept and even insufficiently skilled. At this point, there is rightly a great deal of blame being shared among the three companies involved and, indeed, within the Obama Administration. The net result of the spill will surely rank among the oil industry’s greatest environmental catastrophes.

So what could have been done differently during those first few days of the tragedy? What leadership methods might have been summoned to yield a different result? No surprise that I suggest an open source response.

What if on the third day after the explosion, Mr. Hayward called a news conference and explained the situation. It might have gone something like this...

“We currently estimate that more than 5,000 barrels of oil per day are leaking into the Gulf. Importantly, the source of the leak is, essentially, a broken pipe within our well, more than one mile below the surface of the ocean. At that depth there is almost no experience, even among the most tenured oil well and rig technicians, in capping and sealing a leak. We simply don’t know what we are up against. What we do have is extensive knowledge of the situation, tremendous and relevant experience capping leaking wells, and an enormous conviction to work quickly and tirelessly to prevent further environmental damage. So, as a team – BP, its affiliated partners and President Obama’s Administration – we’re calling on our global community to help. If you have ideas or expertise that might help us to more quickly implement a solution, we want to hear from you. No thought could be too big or too small. We’ll take ideas from any corner of the planet or any scientific discipline. And, we’ve set up a community web site to help receive and manage input. If you have ideas, I’m asking you to go to http://bp.savethegulf.org and let us know as soon as possible. Together, as a global community united to protect our environment, we can fix this tragedy more quickly and completely. Thank you.”

This leadership response has the benefit of authenticity (admitting vulnerability and limitation) and rallies support for a common cause rather than deflecting or trying to prove everything is all right (when it is clearly not). Most importantly, asking for global community involvement would almost assuredly yield ideas and possibilities to more quickly cap the flow of oil into this precious ecosystem. What could be more important?


Brian Gentile
Chief Executive Office
Jaspersoft

Thursday, April 29, 2010

Green Business Intelligence and Overweight Dogs

One of the best parts about being CEO of Jaspersoft is that I get to meet with so many customers and community members. I always learn something interesting. One of my favorite examples of Jaspersoft in action is at Fat Spaniel. You have to love that company name, right? Let me tell you a little more about their products and services.

Founded in 2003, Fat Spaniel Technologies is the leading independent provider of critical software-as-a-service monitoring and reporting tools for the renewable energy industry. Today, the company’s solutions are used by more than 4,000 renewable power plants in 28 countries. Their customers include solar power producers, financiers, systems integrators, OEMs and a growing number of wind power companies. Fat Spaniel solutions help optimize energy output, reduce operations and maintenance costs, contain risk, and increase the return on investment for renewable energy power plant projects. And, they do this using Jaspersoft’s business intelligence suite as their embedded reporting and analysis tool.

Because reporting and analysis are so core to their solution, Fat Spaniel naturally went through a “make versus buy” decision process. It didn’t take them long to realize that partnering with Jaspersoft was the best decision. “We calculated the numbers and realized it didn’t pay off for us to build our own”, said Brett Francis, vice president of engineering and software architecture at Fat Spaniel. After performing what he refers to as “an exhaustive survey of open source BI solutions,” Brett chose Jaspersoft – and we couldn’t be more proud. Choosing Jaspersoft also made sense because Fat Spaniel is a self-proclaimed open source advocate, long committed to both Red Hat Enterprise Linux and Red Hat JBoss middleware.

The company name? The founder literally named the company after glancing at his overweight dog lying on the floor. Good thing he owned a Spaniel and not a Chihuahua.

Here’s a screen shot of the Fat Spaniel Insight Platform:

The Fat Spaniel renewable energy management solution is used by system installers to schedule service and optimize performance, and by owners to track and display renewable energy generation and usage – even performance-based incentives that allow emerging carbon and renewable energy credits. I’m thrilled that, through Fat Spaniel, Jaspersoft is right in the middle of the Green BI movement ☺.

The solution and services running on JBoss Enterprise Application Platform have connected Fat Spaniel’s Insight Platform with JasperServer v3, enabling custom source-data collection, a reporting function for product interaction, and multi-lingual/standard and custom distributed energy reports. Insight and analysis is provided against thousands of plant sites, hundreds of customers, and more than 200 MWs of renewable energy generation and millions of new packets of energy intelligence information daily. Pretty awesome.

If you want to learn more about their solution, check out the press release and the case study, both created jointly with Red Hat.

I’m eager to ensure that every company developing modern software will choose Jaspersoft as its embedded BI platform. Being involved with customers like Fat Spaniel (and partners like Red Hat) reminds me why this job can be so much fun.

Brian Gentile
Chief Executive Officer
Jaspersoft

Wednesday, April 7, 2010

Visualizing The Data of Our World

Jaspersoft is part of a community of millions of people spread out across many cities and many countries. It occurred to me that looking at our own community and applying our own software to visualize that data could be an interesting way to illustrate just how easy, useful and compelling great BI software can be.

I invite you to send me screenshots of your own community (or other geographically-relevant data) after you try some of the things I describe below.

To “see” our Jaspersoft community, we first began looking at Google Earth to help us visualize the dispersed information we had. Our curiosity and technical development with JasperReports helped spawn the free Google Earth Visualization Project, which in itself is a compelling example of how to leverage the flexibility of an open source tool such as JasperReports to visualize data in new ways. My thanks go out to Lucian Chirita of Jaspersoft Romania who initiated this project. I encourage those who want to explore and contribute to join.

With the Google Earth Visualization package and JasperReports, people can read in address data from Excel spreadsheets or a database and export Google Earth data files in KML or KMZ format, similar to how JasperReports can export PDF, XML, HTML or XLS. JasperReports works with almost any data source, including JDBC-wrapped data for relational databases, JavaBeans (EJB, Hibernate), plain old Java objects (POJO), and XML.

The data can either be processed as a batch data job with a popular and free tool such as batchgeocode or processed as an automated web services job that outputs the KMZ file. Even if you are not a developer, both methods are fun to play around with. However, the web services method is the more compelling and interesting way to go for the more technically savvy.
The Jaspersoft Google Earth Visualization package comes with examples and some sample data. Download it and give it a try! Click here for more information on how to download the source code and example for the package.

Here’s a quick example of the locations of where our JasperServer customer community in Europe are based:
Jaspersoft isn’t alone in offering cool new tools to democratize the ability for all of us to visualize the data in our lives. Google recently announced an interesting lab project called Google Public Data Explorer. This is a quick and simple way to apply some of their SaaS tools on publicly-available data Google stores on its cloud. The resulting output can be line charts, bar charts, maps or bubble charts. The downside is that you can only use the data Google has and you don’t have the flexibility and power of Jaspersoft’s tools. Still, it’s another start in the right direction.

The visualization of Jaspersoft’s global community showcases just one example of the flexibility of open source to input and output data in a wide range of formats. Our goal is to enable people to visualize data in new ways and bring new meaning or insight to everyday information.

Visualizing data also helps us all better understand community. Here, community can be used as a metaphor for any business environment, marketplace or passion. In Jaspersoft’s case, our community is the global population of developers and customers using our software. Visualizing our community data helps us focus resources where developers in a specific geographies might be doing particularly inventive things that we want to sponsor or encourage. Commercially, it helps us focus more sales attention in specific countries or regions showing the most promise.

You get the idea.

I invite you to send in your own examples of data you’ve visualized. I’ll share cool screenshots with everyone in a later posting. I’ll also call for screen shot submissions on our JasperReports forum. Then maybe we can run a contest allowing you, the community, to vote on your choice of the best “Visualizing Your World” screen shot examples.

Brian Gentile
Chief Executive Officer
Jaspersoft
Wednesday, March 31, 2010

Jaspersoft 3.7: Audit Logs, Search and Help!

Just last week, we made available Jaspersoft 3.7.0.1 – the version that delivers all the functionality of our latest release, now running on an even wider range of the most popular software platforms such as WebSphere 7, WebLogic 11g, SpringSource tc Server 6.0, Firefox 3.6, and Windows 7. So, to conclude my feature series on Jaspersoft 3.7 and our new Enterprise Edition, I will summarize just a few of the remaining core advancements, highlighting how customer and community feedback helped us drive these in the right direction. In previous posts, I’ve covered Jaspersoft 3.7’s more advanced in-memory analysis and its enhanced visualization (via Flash). Now I’ll briefly describe our new Audit Log, Repository Search and on-line, context-sensitive Help System.

The Audit Log was conceived for and with some of our most active customers, specifically to help them monitor, report, and analyze all events occurring in JasperServer such as running reports and analyses, and adding and updating users. Technically, we added an extensible audit-logging framework into the server along with a pre-populated set of audit objects including an audit log data source, Domain, and set of pre-built reports. Using these, any variety of reports and dashboards can be constructed (drag-and-drop) to create a customized view of what is happening within JasperServer, for usage monitoring, performance tuning, and compliance. Here’s a sample screen of that domain and some pre-built reports.

Next, the Repository Search feature adds much-needed functionality especially for our enterprise customers. Greater data volumes and more varied data types usually yield a repository full of folders, reports and myriad data objects. Navigating only a hierarchical folder system becomes unwieldy and a Search function is required. Our new integrated Search capability allows for free-form searching of any metadata maintained in the JasperServer repository. This means you can find a report by date, name, type and so on . . . very useful and time-saving. Here’s a screen shot showing the search box and a sample result.

Lastly, Jaspersoft 3.7 includes an on-line, context-sensitive Help System that takes users directly to the most relevant documentation. We store this Help content in a centralized location, re-purposing in HTML content taken directly from the wildly popular “Ultimate Guides” series of print documentation. This makes for not only a fast but efficient Help solution. Our customers will appreciate the always up-to-date information and examples. Below, I’ve provided an example of the Help provided when viewing a dashboard.

Beyond these three capabilities, we’ve certified Jaspersoft 3.7 against some of the most popular analytic data stores, including Infobright, Vertica and GreenPlum – as well as JBoss Data Services (formerly MetaMatrix). There are so many new features and capabilities in Jaspersoft 3.7 that I could just keep on writing. But, I won’t. Instead, I’ll suggest that you check it out yourself by viewing a brief demo and downloading our latest release highlights. Your comments and questions are encouraged.

Brian Gentile
Chief Executive Officer
Jaspersoft

Wednesday, March 10, 2010

Jaspersoft 3.7: Visualize This

[This post returns us to my Jaspersoft 3.7 Enterprise Edition features series, after two short posts on important, timely Community matters. To catch you up, my earlier posts on this topic provided an overview of Jaspersoft 3.7 and a dive into its new integrated, in-memory analysis features.]

Many of the most important industry prognosticators cited advanced visualization as a “Top Ten BI Trend in 2010”. Two of my favorite Top Ten lists came from Lyndsay Wise and Nenshad Bardoliwalla. Coincidentally, both ranked advanced visualization seventh on their lists. No surprise, really, as huge growth in data volume, variety and veracity (truthfulness) creates an even more compelling need to discern the critical nuggets from the mountains of seemingly important morsels. What better way to mine information than through rich, interactive visualization techniques?

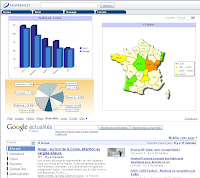
Jaspersoft 3.7 includes hundreds of Flash-based charts, maps and widgets, many of which are available in 3-D and can be animated. The goal is to provide the report and dashboard developer with richer tools to display information so that increasingly-sophisticated users can interact with and explore information to gain insight more rapidly and accurately.

It’s exciting stuff. Animated 3-D gauges and charts can drive powerful new insights. But the biggest “Aha’ reaction occurs when customers consider using interactive maps that bring the geographic dimension of data to life. So much enterprise data exploration could begin with a geographic component, which enables greater understanding and faster insight, but the data is not placed in the context of an actual map because this type of visualization has traditionally been difficult or unavailable. IT systems management information, consumer packaged goods distribution flow, retail location performance, and financial services customer profitability analysis are all customer conversations I’ve had in the past few months – and which will be improved through the more advanced, interactive visualization capabilities available in Jaspersoft 3.7.

Here’s a screen shot of a Jaspersoft Dashboard displaying Flash-based charts (3-D pie and column) and an interactive map. Note that all of these receive commands from a common input control. Note also the mashed-up web content below the graphs, which delivers relevant contextual information for the dashboard user (and which can also receive common input control).

How could you use interactive, animated 3-D charts, maps and widgets to make your data much more useful? To learn more about this and other features of Jaspersoft 3.7, check out our brief demo. I look forward to your comments.

Brian Gentile
Chief Executive Officer
Jaspersoft
Monday, February 22, 2010

It’s About The Community


[This post represents another brief break in my Jaspersoft 3.7 Enterprise Edition features series, this time to recognize Jaspersoft reaching some significant community milestones, announced today.]

In January, Jaspersoft surpassed the 10 million download mark – which places Jaspersoft among an elite handful of commercial open source vendors. Even more incredible, we’re not making an operating system, development language or middleware. We develop enterprise-class business intelligence software!

But the most important milestone for us was the number 120,000. That’s how many registered members in our community have now signed up to partner with us in working on more than 350 projects that extend and amplify Jaspersoft’s platforms. Today we have by far the largest total ecosystem in all of business intelligence. More than Cognos. More than Business Objects. And more than Hyperion. This community is incredibly global, with more than 150 countries represented and contributions coming from nearly every corner of the globe.

Today we’re marking this incredible progress with an announcement about the great strides our community has made in helping millions of people around the world solve real business problems with open source business intelligence software.

Jaspersoft recognizes that a growing successful community of interest is also about participation. Everyone pitches in. And, if we’re not creating real value for this great community of people, they’ll move on. That’s why Jaspersoft and the community, to-date have contributed more than one quarter of a million lines of software code each to our wildly popular JasperReports, iReport, JasperServer and JasperAnalysis projects. To put that into a business context, Jaspersoft and its community’s contributions to these projects represent an estimated $9 million engineering investment, according to Ohloh.net.

Most amazingly, we’re proud of the innovation that comes from our community’s use of Jaspersoft’s reporting and analysis software. By our leading and organizing the development of this powerful BI platform, so many others can put it to work in ways we can scarcely envision. For example . . .

Spiral Universe uses JasperReports and iReport to flexibly design and deploy reports for schools. From class attendance records to complete transcripts and even grade cards, this is a great use of our highly precise, sophisticated reporting tools. And, Sinfo One SpA uses JasperServer to integrate reporting and analysis into its ERP software, which provides a simple but powerful way to update an older system and deliver new value to its customers.

My hat’s off to the engaged and energetic community members who, by collaborating and participating, make the complete Jaspersoft experience so much more valuable.

The contributions that Jaspersoft makes to our community and the vibrant community that in turn supports us with their innovation help make us not only a good open source software partner but also a more successful commercial company. Earlier this month, Jaspersoft was awarded a prestigious Intelligent Enterprise Editors’ Choice Award, cited as one of the most important “Companies to Watch” in 2010. One of the several reasons for this recognition is the significant community of developers and practitioners that we’ve fostered. I’m particularly proud of Jaspersoft’s gritty, community roots and want to ensure we remain true to its ideals and this heritage. My thanks to Intelligent Enterprise for recognizing this.

Brian Gentile
Chief Executive Officer
Jaspersoft

Thursday, February 4, 2010

Jaspersoft 3.7 Community Release: Next-Generation BI for Everyone

[This post represents a brief break in my Jaspersoft 3.7 Enterprise Edition features series to recognize the official announcement of Jaspersoft 3.7 Community release, available today.]

As the leader in open source business intelligence, Jaspersoft shoulders an important responsibility to its open source community. In return for our community’s involvement and contributions, we sponsor and create an incredibly valuable set of BI platform projects and then make them available for all to download and use (mostly under the terms of the GPL). I’m thrilled that our Jaspersoft 3.7 platform is now available in the Community Edition, source code and all, just a few weeks after we released our commercial versions. You can download the Jaspersoft 3.7 Community release here.


I’m particularly proud of this 3.7 release because nearly 5,000 community members downloaded and helped us evaluate, critique, test, and ready it for release. Accordingly, v3.7 includes so many new features and capabilities, a short list of which includes:

  • Search-powered report repository, making it easier to find reports and report objects;
  • Support for report output types such as open office and the latest Microsoft file format extensions (xlsx and docx);
  • New cascading input controls enables smarter, easier-to-use reports;
  • New native support for Macintosh OS X;
  • Support for XLS as a data source;
  • Expanded user management web services; and
  • New reporting enhancements such as list component, multi-band for a single report, footer positioning, and sorting for crosstabs.

Our primary job is to make our open source BI platform feature-rich and highly useful for a broad range of customers. If we are successful, many will download and use this freely-available version. To ensure our platform contains the functionality required by a broad BI-using audience, we have gone to some length to involve our Community in its development.

Two of the most helpful possibilities for our community’s involvement are project-based feature-voting and community-based translation (called JasperBabylon). Here is an example of feature voting (for the iReport project), which has been available since last October and allows our community to help us constantly calibrate our product roadmap. JasperBabylon is our community-based translation project for developers to collaboratively develop language packs for the Jaspersoft Business Intelligence Suite. Based on our community’s involvement, we have many language translations available for each of our core projects (iReport, for example, has about 40 languages available at some level of translation!). These are two of my favorite examples of our community in action. I appreciate this every day.

Take a look at Jaspersoft 3.7 Community Release and let me know what you think. Your comments and feedback are always appreciated.

Brian Gentile

Chief Executive Officer

Jaspersoft


Monday, January 25, 2010

Jaspersoft 3.7: Advanced In-Memory Analysis

We have been working toward in-memory analysis capabilities, within JasperServer, for a couple of years. With our previous major release, Jaspersoft 3.5, we made an important declaration: in-memory analysis techniques are going to be a very important part of our future product direction. Being an open source BI company means a commitment to innovative technology and value for customers. An in-memory strategy gives customers, both enterprises and ISVs, more options to improve their decision making. So, you’d expect that Jaspersoft 3.7 would meaningfully advance our Server’s in-memory, multi-dimensional analysis capabilities. What you might not expect is just how far it goes.

Firstly, in-memory analysis enables JasperServer to hold the query result data set in memory, complete with sufficient meta-data that enables the user to continue analyzing the data along multi-dimensions, without having to re-issue a new query. And, the user manipulates the results using an enhanced data explorer interface, which is a simple, purely web-based, drag-and-drop environment. So, the outcome is a fast and friendly way to sort, filter, pivot, compare, and drill into data without having to separately design and maintain OLAP cubes or having to use a special front-end tool to interact with those special data sources.

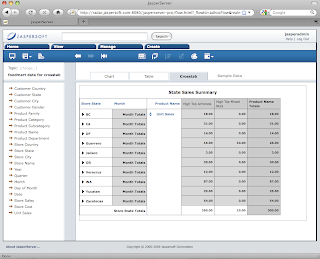
What can be done with Jaspersoft 3.7’s new in-memory analysis? The screen shots below provide an example of a cross-tab report, complete with multiple dimensions being viewed (Locations in the form of States and Cities and Product by Name and Type) and a pie chart that graphs some of the data from this report (sales summary by State). The user can add dimensions and measures just by dragging and dropping and then re-orient or adjust existing dimensions by “pivoting” . This cross-tab report can include summary calculations, calculated fields, sorting and filtering. And, the user can continue clicking on data until he or she reaches the ultimate transaction, should they wish.


JasperServer In-Memory Analysis; Cross-Tab Report and Pie Chart

So what does In-Memory Analysis mean for Jaspersoft customers”? Unlike other traditional and in-memory BI vendors, we’re taking the best of both worlds approach whereby the system administrator can configure the server to perform processing either against the in-memory data set, or alternatively, push processing down to the underlying data store. The decision on which approach is optimal for a given deployment will depend a lot on the query performance characteristics of the data store. For example, a traditional OLTP or non-relational data store may benefit significantly from in-memory processing, whereas a query optimized analytic data store may provide performance similar to or better than in-memory processing. Combining this flexible architecture with the cost advantages of not using an OLAP server gives customers choice and a BI platform that can grow as their data and analysis requirements do.

This is just a summary of the many in-memory analysis capabilities we’ve included in Jaspersoft 3.7. I invite you to check out some additional information and a demonstration here.

Next post, I’ll describe our quest to provide rich, Flash-based visualization to make every report, dashboard, and web application come to life.

Brian Gentile
Chief Executive Officer
Jaspersoft

Wednesday, January 13, 2010

An Upgraded BI Platform and a New Enterprise Edition

Yesterday we shared our news about Jaspersoft 3.7 and the new Enterprise Edition. It was a big day.

It’s worth going into a little more detail today about what the difference is between the product suite news and the new Enterprise package. I’ll briefly provide an overview of the features of each and in the following weeks, I’ll highlight some of the specific bells and whistles (translation: capabilities and screenshots) of the most significant ones.

Jaspersoft 3.7 delivers more than 20 significant new features in total. The top five categories where most of the new features are delivered include:

1. advanced in-memory (multi-dimensional) analysis capabilities;
2. Flash-based visualization (3D, interactive charts, maps and widgets);
3. a new repository search function;
4. online, context-sensitive help; and
4, key certifications for some of the most robust (and cost-effective) analytic data stores (Infobright, Vertica and Greenplum) and a federated query platform (Red Hat’s JBoss Data Services, formerly MetaMatrix).

Then, the Enterprise Edition, the third package (or “Edition”) now available from Jaspersoft, offers features for our enterprise-class customers working on the most complex BI projects. Enterprise Edition includes JasperETL for data integration, JasperAnalysis for complete relational OLAP services, a new audit logging/compliance feature and multi-tenancy capabilities. Administrators gain greater manageability, control and visibility into the Jaspersoft BI platform with these advanced features. This bundle of products and features are exclusively available today in the Enterprise Edition.

My next post will begin my drill into the Jaspersoft 3.7 platform features listed above. I’ll start with the advanced in-memory analysis capabilities. As always, I look forward to your comments, questions and feedback!


Brian Gentile
Chief Executive Officer
Jaspersoft

Tuesday, January 12, 2010

A BI Milestone: Jaspersoft 3.7 and New Enterprise Edition

Today marks an important day in the BI industry: for the first time, CIOs and IT managers can get all of the most powerful BI features in one package at an affordable price. Of course, such an advancement should be delivered by an open source BI vendor.

Jaspersoft is unveiling two things today: Jaspersoft 3.7, which is our new BI platform release, and Jaspersoft Enterprise Edition, which is a new and complete packaging of our most advanced BI products and features.

Jaspersoft 3.7 includes significant enhancements to major feature areas such as in-memory analysis, Data Warehouse certifications and Flash-based visualization. And the new Enterprise Edition is packaged and priced for customers of any size who are dealing with complex BI challenges and advanced workloads, but are too smart to over-spend on an aged, proprietary BI product.

This product announcement is important because it’s been driven more than ever by our discussions with enterprise-class customers and by community sentiment about the challenges they face. And, I’ve written previously about some of the major industry trends that are now obvious and create a new market reality, including the explosion of data and the new economics of IT. In fact, Roger Burkhardt, CEO of Ingres, and his team have been talking about the new economics of IT as a trend for some time. Here’s what Roger has to say about this Jaspersoft product announcement:

"We are thrilled to see Jaspersoft respond to the demands of their customers by introducing a new powerful Enterprise Edition with advanced BI functionality. At Ingres, we are believers in the democratization of business intelligence as part of a larger trend to embed intelligence and collaboration deep into the organization. Open source software, in particular Ingres Database and Jaspersoft 3.7, provides a far less expensive, faster and easier path to value, even for advanced customer requirements.”

In total, these trends bring the often-sought-after smaller enterprises to our door in increasing numbers. A lot of large enterprises use Jaspersoft today, but we’re seeing small and medium-sized business want our wares for increasingly complex BI projects. Today’s news directly impacts this SME audience by providing advanced BI support at a price and overall investment level that can’t be beat. We call it “enterprise-class BI for organizations of any size”.

Starting tomorrow, I will post a short blog that outlines some of the major new features included in this new product release. Then, I’ll follow that with one post per week through the end of this month, each more fully describing one of the major feature advancements. Follow along and you’ll see why this is an important day for BI.

As always, I welcome your comments.

Brian Gentile
Chief Executive Officer
Jaspersoft

Tuesday, January 5, 2010

Calling All "Jeopardy!" Geeks (and maybe some BI Geeks, too)...

Guest Post from Mike Boyarski, Director of Product Marketing, Jaspersoft

Thanks to Brian for letting me announce our BI Jeopardy contest on his blog.

We’re preparing for a really big 2010 and are kicking it off next week with a significant product announcement. If you’ve been following any of our Twitter feeds (Jaspersoft, Brian Gentile, Mike Boyarski), you know we can barely keep our mouths shut about it.

We wanted to find a way to ignite that same kind of energy this year among our online community of customers, partners, analysts and reporters, and thought what better way to kick it off than to have some good plain fun this month!

Starting today and for the next four weeks, we will be playing BI Jeopardy on our @jaspersoft Twitter feed. Taking a page from Alex Trebek, we will put out an “answer” every Tuesday and Thursday. Each person to reply to Jaspersoft via Twitter using our handle (@jaspersoft) with the correct “question” will be entered into a drawing for an iPod Nano. You can only be entered into the drawing once per answer and question, so that’s two opportunities to be entered per week. The drawing will take place on February 1.

Even better - - you don’t have to necessarily get the “question” right to be entered into the drawing. We will choose one person each day who uses the #jasperBIjeopardy hashtag to enter into the drawing. So hashtag away! And everyone who qualifies for the drawing gets a Jaspersoft t-shirt. Doesn’t get much better ☺

Mike Boyarski
Director of Product Marketing
Jaspersoft

Monday, January 4, 2010

Prediction for 2010 #4: New Leadership in Open Source

I believe the landscape of open source companies will substantially change in the next year with continued acquisitions, one IPO and some new upstarts becoming high flyers. Some may wonder if a return to a stronger economy will spell softer times for open source software, meaning: will IT organizations and developers return to the sinful spending of the past? I say absolutely not. The benefits of the open source model are too well-aligned with the new needs of IT and developers to be so easily abandoned.

So, the now-legitimate open source model combined with a return to a stronger economy will lead to even better growth and financial results for leading open source companies. In this sense, the strong and well-built open source companies will get stronger: Ingres, Alfresco, SugarCRM, Talend and Jaspersoft, for example, will reach new heights.

And, relative open source newcomers who can substantially disrupt in their sector will make big gains as well. I believe these up-and-comers will gain new and deserved center stage profile.

Lastly, I also believe that some even earlier-stage open source software companies will come on the scene strongly, becoming the new “ones to watch”, starting this year.

The Open Source Center Stage

Watch for these companies to break away, driving real disruption in their sectors.

Acquia – the commercial open source extension of the Drupal project is doing for web content management what Alfresco is already doing in the enterprise content management. Have you heard of a substantial web site being built recently that wasn’t using Drupal? Acquia stands to gain handily from this trend.

MindTouch – with fierce and varied competition in the wiki collaboration space, it’s clearly a tricky segment to pick a winner. But MindTouch has managed to make huge inroads to serve both open source and commercial communities with its open core business model. And it has differentiated its product with both a service-oriented architecture, key for mashing up content with other systems, and with its friendly GUI designed for business users.

Wavemaker – 2010 just might be the year to crown WaveMaker the “PowerBuilder for the web” (a reference to the most successful client/server 4GL tool of the 1990s). Building and deploying advanced, web-based apps quickly and efficiently is critical to the next-generation internet and Wavemaker just may hold the key.

The Newest Ones to Watch

You may not have heard of these companies yet, but I bet you will in 2010.

BonitaSoft – after years of design and development to provide a commercial open source business process management system, this product won the Open Innovation Award in Paris in 2009.

Lucid Imagination – an enterprise search tool, built on the remarkably popular Lucene engine and financed by notable investors, it’s hard to see where this will go wrong.

zAgile – finally a commercial open source tool that enables collaborative software engineering, this product should expand the market led by CollabNet and many proprietary options (including IBM, Oracle, Borland and Microsoft). Looks like some disruption is coming soon.

In 2010, the open source software landscape will continue to shift and change, but you can count on consistently strong innovation and disruption. Which companies do you think I’ve missed? Who will make a new open source mark in 2010? Your comments are welcome.

Brian Gentile
Chief Executive Officer
Jaspersoft